
来自 TikTok Shop 官方资料快照 ·
- 当前资料结构化阅读页
- 固定快照已留存,可追溯
- 官方原文可核对
资料正文
§1 [TSP US]TTSPC Data Compass Playbook
#§2 Update Table
Update Table
| Date | Updates |
|---|---|
| 2024.6.13 | Simplified and streamlined Seller Center Access: TSPs can effortlessly share a request for Seller Center access with sellers and obtain authorization. **** After authorization, TSPs can access Seller Center directly from the Partner Center ++with just one click.++ TSPs are allowed to access up to six months of historical data now. |
| 2024.05 | Launched Shop Analytics to provide shop overall metrics and GMV attribution analytics for shop-level bound TSPs |
| 2024.04 | Launched Video Inspiration for TTSPC brings agency partners relevant data and tons of ideas for creating highly engaging content and optimizing video creation strategy. |
| 2024.3.20 | GMV attribution logic changed to the new one: 100%GMV(Direct GMV)=Live +Video Product Card |
For an overview of the changes in how Shop GMV is calculated, please refer to the link: GMV Refactoring One Pager
§3 🔥🔥What ability can be provided by Data Analytics?
#§4 Product Feature
Product Feature
Image
§5 Service Category x Data Analytics Feature Map
Service Category x Data Analytics Feature Map
| First Category | Partner Role | Secondary category | Service Description | What Analytics modules can partner access? |
|---|---|---|---|---|
| Creator Service | Creator Service Partner | Creator Management | Emphasizes deep creator relationships through: - Educational support, resource provision, and hands-on guidance for SV and live - streaming (especially live sessions). Responsibility for creator incubation, upgrading their level from novice to top-tier. | Data Overview, Live Analytics, Video Analytics, Product Analytics, Creator Analytics, Custom Report |
| Seller Service | Seller Service Partner | Shop Management | Store operation services for merchants include store setup and decoration, product management and listing, marketing promotion planning, and customer service, aiming to boost store traffic, sales, and brand influence. | Data Overview, Shop Analytics, Live Analytics, Video Analytics, Product Analytics, Creator Analytics, Affiliate Analytics |
| LIVE Management | TSP provides self-LIVE services for merchants covering live streaming planning, content creation, equipment setup, host training, real-time operation, and data analysis. The goal is to enhance exposure, attract traffic, boost conversion rates, and maximize sales through merchants’ self-live streams. | Data Overview, Shop Analytics, Live Analytics, Video Analytics, Product Analytics, Creator Analytics, Affiliate Analytics | ||
| Short Video Management | Short-video services for merchants include content planning, video shooting, editing, optimization, and distribution. Services also involve optimizing titles, tags, and descriptions to boost search rankings and exposure, helping merchants target users precisely for enhanced followings, retention, and conversions. | Data Overview, Shop Analytics, Live Analytics, Video Analytics, Product Analytics, Creator Analytics, Affiliate Analytics | ||
| Seller affiliate Management | Primarily seller-focused, this involves: helping sellers select optimal products, set competitive commissions, and list them in open commission markets or launch seller-initiated campaigns to invite creators to promote products. | Data Overview, Shop Analytics, Live Analytics, Video Analytics, Product Analytics, Creator Analytics, Affiliate Analytics | ||
| Shop registration | Shop registration service includes assisting sellers to complete the onboarding process on TTS and can track referral relationships with the assistance unique and exclusive onboarding link obtained from the TTS platform. | Data Overview, Shop Analytics, Live Analytics, Video Analytics, Product Analytics, Creator Analytics, Affiliate Analytics | ||
| Seller Service - Creator Matchmaking | Creator mathmaking | - Source market products or collaborate with sellers to identify trending/suitable items and aim for higher commissions for creators, then drive creators to produce content. - Guide creators on conducting SV with higher CVR to boost GMV, while ensuring compliance with GNE rules. | Data Overview, Custom Report |
§6 Application Scenarios
Application Scenarios
++Scenario 1: Live Operation - Analyze real-time live & recap performance, Monitor multiple livestreams at the same time.++
<div style="text-align: center"><strong>Real-time monitoring of live transactions</strong></div>
Image
- Monitor user's entry/live trends, capture traffic peaks and seize high conversion opportunities.
- Analyze the conversion of different products to find potential products with low impression and high conversion.
<div style="text-align: center"><strong>Monitor multiple livestream</strong></div>
Image Monitor all creators' performances who are doing livestreams at the same time, find highlights and lowlights in the live room more quickly.
<div style="text-align: center"><strong>Recap creator historical live performance</strong></div>
Image
- Check each creator's past live performance to monitor their diligence and sales performance in a period.
Image
- Monitor the number of videos posted by each creator and overall video sales performance.
- Analyze each video's product sales and find the best performance video recently to give more promotion budgets.
++senario++++ 2: Video Operation - Find good performance videos and Replicate Success Cases.++
<div style="text-align: center"><strong>Monitor video performance</strong></div>
Image
- Monitor the number of videos posted by each creator and overall video sales performance.
- Analyze each video's product sales and find the best performance video recently to give more promotion budgets.
<div style="text-align: center"><strong>Learn from excellent video</strong></div>
<div style="text-align: center"><img src="https://p16-arcosite-sg.ibyteimg.com/tos-alisg-i-k9wyc2ijk0-sg/0068ef6bf6ae4d4f852cdbbf6e80aa14~tplv-k9wyc2ijk0-image.image" width="704px" /></div>
- Analyze the sales performance of different products within one video and find suitable product for this video content.
- Learn from excellent examples of selling the same product, optimize your own video content to make the content more attractive.
- Analyze each video's finish rate and traffic trends, summarize high finish rate/traffic videos' production experience.
++Scenario 3: Product Strategy - Monitor different creators' product sales Performance++
<div style="text-align: center"><strong><img src="https://p16-arcosite-sg.ibyteimg.com/tos-alisg-i-k9wyc2ijk0-sg/aabd75a249f843ba8c981fdee1f83bf8~tplv-k9wyc2ijk0-image.image" width="874px" /></strong></div>
<div style="text-align: center"><strong>monitor product sales performance</strong></div>
<div style="text-align: center"><img src="https://p16-arcosite-sg.ibyteimg.com/tos-alisg-i-k9wyc2ijk0-sg/87c8e96411cc41d9a0cb4b47c3df773a~tplv-k9wyc2ijk0-image.image" width="800px" /></div>
- View each creator's sale performance, understand the best performance products, and match the creator with suitable products.
- Filter by shop to check how much GMV has been achieved by this partner's creator or each creator, easier to calculate the goal achievement of each shop.
<div style="text-align: center"><strong>Analyze each product's performance</strong></div>
Image
- Analyze each creator's contribution to product revenue and find which content created most revenue, learn from the good examples and adjust creator's product strategy.
- Analyze product's buyer profile and match it with creator's followers profile, find the potential creators for the product.
§7 ❗️❗️Important Notice for New TTSPC:
#§9 🔥🔥[NEW]One-click access to Seller Center
Under the [Shop List] heading, you will see a list of all the sellers with whom you have a binding relationship with and those who have provided you access to view their data in the Seller Center.
<div style="text-align: center"><img src="https://p16-arcosite-sg.ibyteimg.com/tos-alisg-i-k9wyc2ijk0-sg/52f34fbd28154979b3109fd50edefb2a~tplv-k9wyc2ijk0-image.image" width="1440px" /></div>
This option will ++only++ be accessible to TSPs who have already been provided access by their seller to view data in the Seller Center. And TSPs must be in these three subcategories:
- Affiliate Management
- Shop operation and management
- Paid Media
- Shop Management
- Shop Registration
- Integrated Marketing
- Operational Training and Mentoring
If you're a new TSP or have not sent an authorization request to the seller to view their data, you can follow the steps below.
§13 🌟🌟Data Function Introduction:
#§14 Data Overview
#§15 How to use data overview?
How to use data overview?
- To understand the overall transaction performance and sales rate of the partner's related accounts, and to see the percentage of partner with sales, to determine the activity of its sellers and the partner's ability to sell goods.
- Analyze the live/video content channels to analyze the ability of the partner's bound sellers to sell goods, the number of content releases and the CTR conversion efficiency.
§16 Detail introduction of functions
Detail introduction of functions
- Present the sales performance of Partners
Core indicators:
- Livestreaming Partners: The number of partners that have livestreamed during the selected period
- Partners with Sales: The number of partners that generated in revenue during the selected period
- Active Rate: (Active Live Partners/Partners) * 100%
- Sales Rate: (Partners with Sales/Partners) * 100%
- Present the overall sales trend of Partners
- GMV (Total): The cumulative amount paid for orders generated from all partner channels during the selected period, including in-house and Affiliate channels, and including returns and refunds
- GMV (Livestreaming): The cumulative amount paid for orders generated from partner livestreams during the selected period, including returns and refunds
- GMV (Video): The cumulative amount paid for orders generated from partner videos during the selected period, including returns and refunds
- Avg. GMV (Livestreams): GMV (Livestreaming) / Livestreams
- GMV (Refunds): The cumulative amount successfully refunded to buyers during the selected period
- Show the live sales & conversion trend
- Livestreams: The number of in-house livestreams/livestreams by partners during the selected period
- Duration: The cumulative duration of in-house livestreams/livestreams by partners during the selected period
- Orders: The number of orders created and paid by users from all partners' in-house livestreams/livestreams
- Product Sales: The cumulative number of products sold from in-house livestreams/livestreams by partners during the selected period
- Avg. CTR: (Number of product clicks / number of livestream views) / livestreams
- Show the video sales & conversion trend
- Videos: The number of videos posted by partners during the selected period
- Orders: The number of SKU orders created and paid by users from partner videos
- Product Sales: The cumulative number of products sold from partner videos during the selected period
- Avg. CTR: (Number of product clicks / number of video views) / number of videos
<div style="text-align: center"><img src="https://p16-arcosite-sg.ibyteimg.com/tos-alisg-i-k9wyc2ijk0-sg/a098c0b391404fd8a271acd76323661b~tplv-k9wyc2ijk0-image.image" width="1036px" /></div>
§17 Shop Analytics
#§18 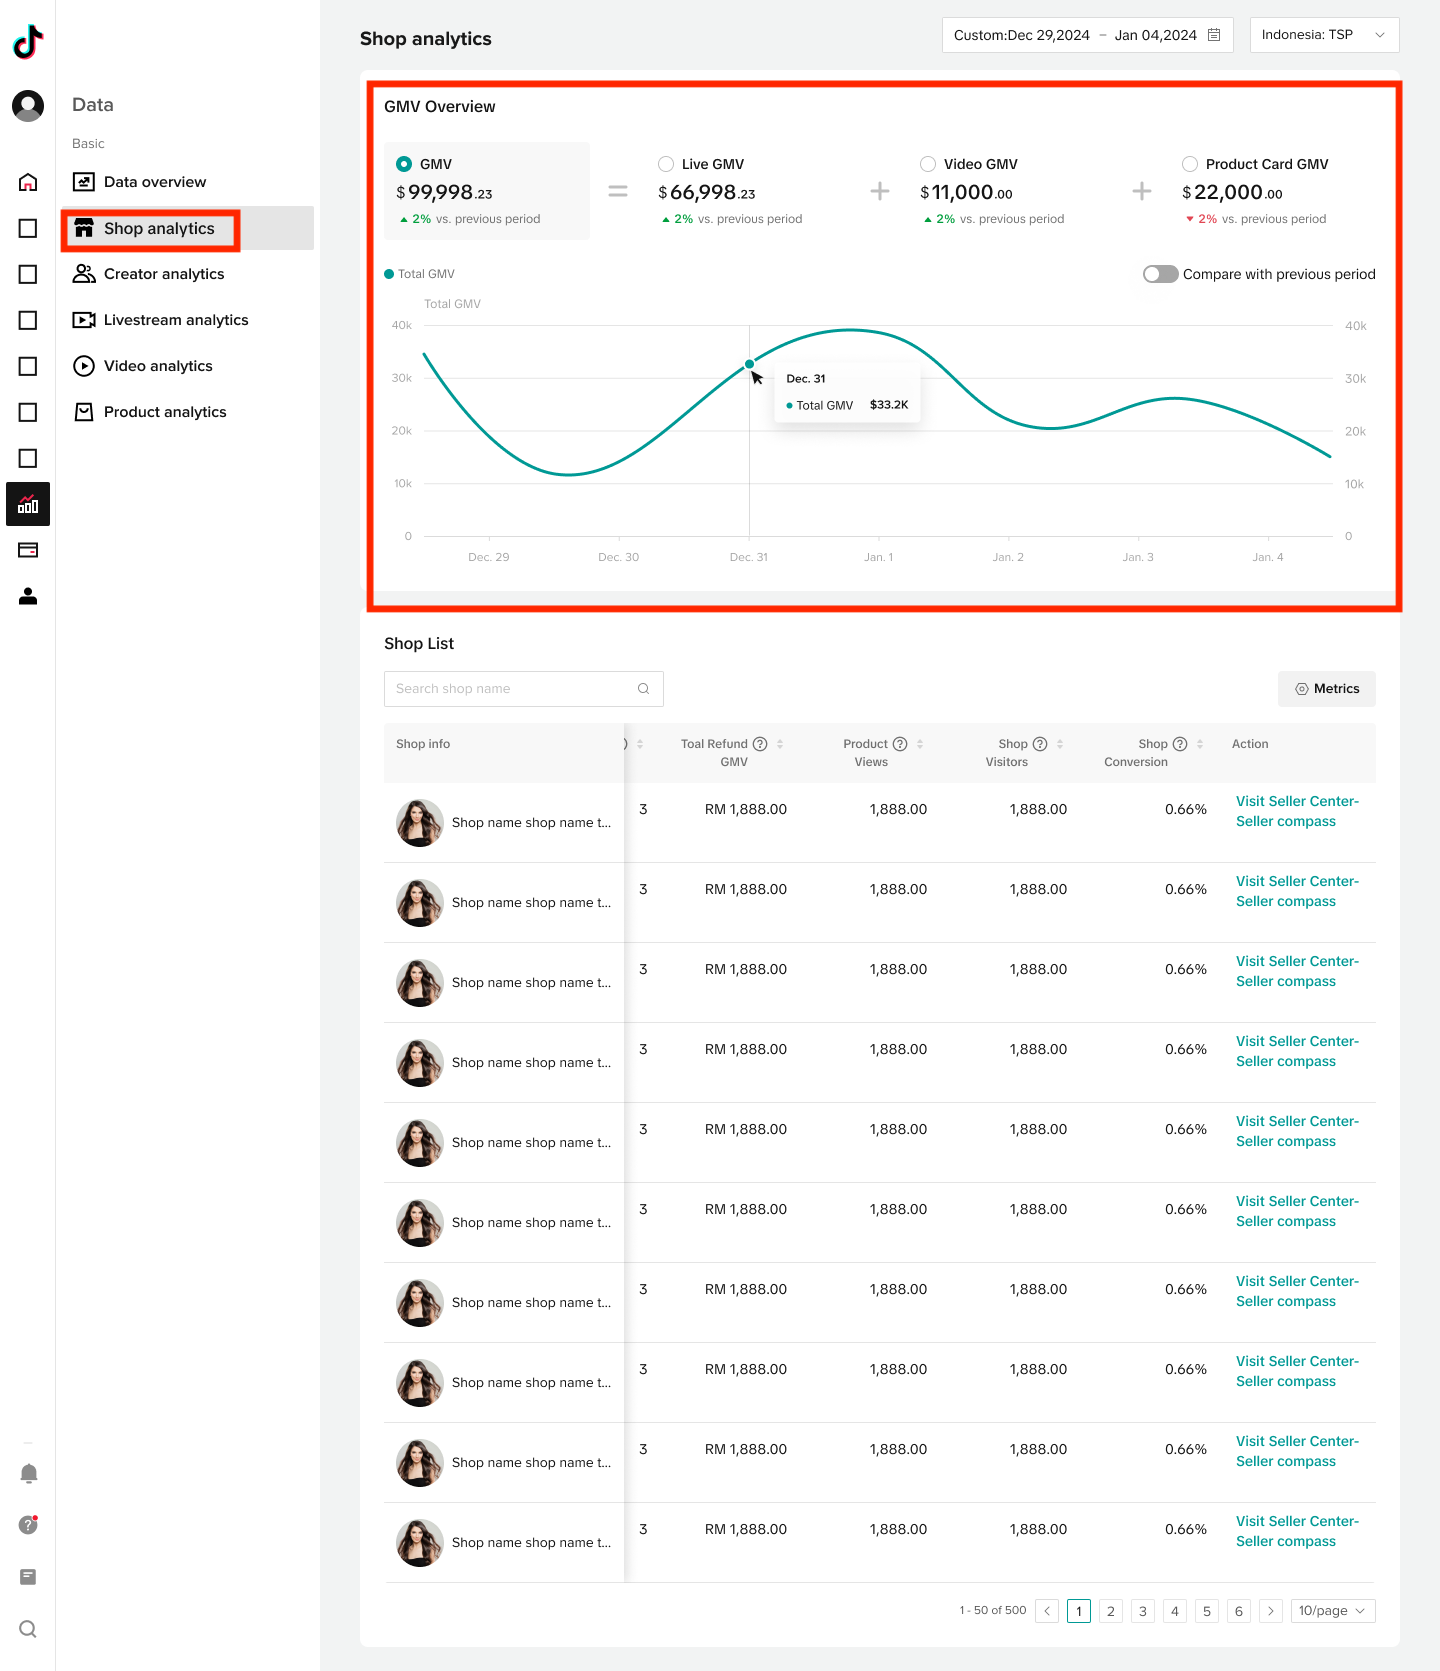
Image
background: When a partner binds a shop to provide shop level management services, it's crucial for them to have an overview of the shop level data and conduct further analytics to optimize their operation strategies.++ From June 2024, TSPs are allowed to access up to ++++six months ++++of historical data from current date or bind date++
§19 Introductions
Introductions
When TSPs bind at Shop level, they will have access to Shop Analytics that will have data for all accounts(Seller/Creator) associated with the Shop. T Image be precise, Shop Analytics data should be accessible only when TSPs and Seller bind at a Shop level. We have updated the Shop Analytics tab to provide you with a new GMV section. This will show the overall GMV for all sellers who have authorised you to view their data. Besides, you will be able to view the key metrics of each shop you manage, shown in the image below. The Direct GMV figures listed here mirror the ones displayed on the Seller Center. Image Aggregated Metrics Under the GMV overview section you will see the following aggregated metrics.
- GMV: This will display total GMV aggregated from all accounts.
- Definition: Total amount paid for orders during the selected period, including cancelled and refunded orders.
- LIVE GMV: This will display the LIVE GMV at a shop level aggregated from all accounts and sources.
- Definition: The total amount paid for orders placed directly from LIVEs, including returns and refunds.
- Video GMV: This will display the Video GMV at a shop level aggregated from all accounts and sources.
- Definition: The total amount paid for orders placed directly from shoppable videos, including returns and refunds.
- Product Card: This will display the Product Card GMV at a shop level aggregated from all accounts and sources. There are several sources of Product Card GMV: Search, Recommendations, Shop Tab, Showcase, Store.
- Definition: The total amount paid for orders placed directly from product cards, including returns and refunds.
When you click on a metric you will see the corresponding trend data for that metric being reflected in the graph. Image Period Comparison You can enable the [Compare with previous period] button which will display % comparisons for each data metric and will compare to previous period. You can use the date range selection to select data for the current period. When you select the [Compare with previous period] option, this will automatically display the data for the previous period Example:
- If your current date range was for the month of March 2024, the comparison period will be February 2024
- If your current date range was for Q1 2024, the comparison period will be Q4 2023
<div style="text-align: center"><img src="https://p16-arcosite-sg.ibyteimg.com/tos-alisg-i-k9wyc2ijk0-sg/544b73e9218e4d95b1d6f4761af967e3~tplv-k9wyc2ijk0-image.image" width="1440px" /></div>
The comparison will be reflected using percentages and will display the corresponding data in the graph using two color schemes:
- Green color reflecting positive changes (increase in % vs previous period)
- Red color reflecting negative changes (decrease in % vs previous period)
Image
§20 Livestream analytics
#§21 Background:
Background:
There is insufficient trust between the seller and the organization. For example, in the Indonesian market, 95% of sellers are unwilling to provide their accounts directly to the organization. As a result, the partner does not have enough data to assist the sellers in optimizing the live. 90% of the sellers and partners have remote contact. The TSP hopes to view the data through the portal to achieve real-time guidance to the sellers.
§22 Problem We Solve:
Problem We Solve:
Without obtaining the seller's account and log in to the streamer desktop to obtain the seller's LIVE data to help the seller to optimize the operation strategy When the partner‘s seller starts LIVE, partner can achieve the real-time guide for seller
§23 Key Function:
Key Function:
- Partner portal live screen: support to view live & real-time data of multiple sellers at the same time
- Review the live data: support viewing the historical live data of its sellers
- Authorization of the seller data:Only after the partner obtains the permission of the seller data, it can check the data of its seller's
§24 Detail of product:
Detail of product:
- Ongoing livestreams
There are sellers on live:
<div style="text-align: center"><img src="https://p16-arcosite-sg.ibyteimg.com/tos-alisg-i-k9wyc2ijk0-sg/b9a5ccb792864c7d92280a3d1882891b~tplv-k9wyc2ijk0-image.image" width="958px" /></div>
Here, you can see the avatars, names and handles of people who are currently on LIVE (you can filter specific seller by name or handle). After clicking the upper left corner, the corresponding live room card of the person will appear below. For those who have obtained data authorization, the number of online people, the number of transactions, the number of payment orders, and the number of product clicks will be displayed on the card.
<div style="text-align: center"><img src="https://p16-arcosite-sg.ibyteimg.com/tos-alisg-i-k9wyc2ijk0-sg/8d57237c4cf849fe85535f31d9d70711~tplv-k9wyc2ijk0-image.image" width="518px" /></div>
When we click on any live card, more detailed information will be displayed, the number of online people, the number of transactions, the number of created orders, the number of payment orders, the number of product exposures, the number of product clicks, GMV, and comments.
<div style="text-align: center"><img src="https://p16-arcosite-sg.ibyteimg.com/tos-alisg-i-k9wyc2ijk0-sg/4f4641d535144b17bdeb16af2271f08e~tplv-k9wyc2ijk0-image.image" width="954px" /></div>
In the card in the picture above, click [live Board], it will jump to the live screen of this seller. Then you can get more detailed data of the seller
- All livestreams
First of all, at the top, you can filter the sellers by name and handle, and view his historical live. NOTE: Newly added the "Export" function at the right side corner.
<div style="text-align: center"><img src="https://p16-arcosite-sg.ibyteimg.com/tos-alisg-i-k9wyc2ijk0-sg/5ad0e3413429487c90565b9dce5f087d~tplv-k9wyc2ijk0-image.image" width="934px" /></div>
§25 🔥🔥🔥**Live Board**
🔥🔥🔥Live Board
User Manual: How to use LIVE Board to monitor LIVE Performance
- Goal: Help understand the live data performance of each account in real time, and be able to recap livestream performance
- Approach:
You can access the live board of the livestream of each ec livestream, and perform real-time data tracking and data recap after the livestream ends Now there are two versions of LIVE Board online: Basic and Advanced. You can switch between them with one click to monitor real time LIVE Performance according to your preference.
- Click here to see the introduction of LIVE Board - Basic version.
- Click here to see the introduction of LIVE Board - Advanced version.
Image Image
§26 Creator analytics
#§27 Background:
Background:
When Affiliate Partner can't get sales data of bound sellers, it is difficult for organization to compare performance of different sellers. As a result of that, organizations can't make operation strategy for sellers' advantages and disadvantages.
§28 Applied Scenarios
Applied Scenarios
- Master the content production ability of sellers
By intuitively showing CTR、CO、RPM indicators, seller analysis can help organization analyze the content output quality of the sellers.
- analyze the performance of sellers
Showing the exposure, conversion and transaction efficiency of all sellers in both live/video can help partners quickly grasp the content attractiveness and the ability to monetize the goods of the sellers, so that determines the long-term cooperation strategy of the talents and partners.
- tracking commission income
seller analysis can help organizations understand the commission income of different sellers to get out the total income of the organization.
§29 Functions
Functions
- Show the conversion ability of the sellers.
- The transaction, traffic and interaction data of sellers will be displayed respectively by live/video.
- Support to apply for data authorization from sellers.
§30 Detail introduction of functions
Detail introduction of functions
First of all, log into the 【Affiliate Partner】-【Creator Analysis】. Data of authorized sellers will be shown in 【Creators】. Partners can send an authorization application to seller clicking request authorization in 【pending authorization 】if partners haven't get authorization of sellers yet. NOTE:
- Newly added the "Export" function right after the button "Metrics".
- Added metrics "Settlement GMV" (30 days) for L2L CAP partners to see how much they can get from TTS based on their managed creators.
Image After getting authorization from sellers, partners can look for the date of sellers' transaction rate、interaction rate、conversion rate and fans in seller Analysis.
§31 Video analytics
New Updates:
- Added the "Export" function right after the button "Metrics".
- Delete the "All Creators" filter in [Video Analytics] and [Product Analytics].
- Remove the function "filter by" and support "search" by video/product name in [Video Analytics] and [Product Analytics].
- Exclude the metric "Shops" in core data and update the metric "Products" to "the number of products with sales during the selected period" in [Video Analytics] and [Product Analytics].
- User profile: Provide age, gender and country/regions distribution in [Video Details] and [Product Details].
The new video analytics on the partner platform helps partners get a comprehensive view of the video performance of managed sellers, measure their diligence, content creativity, content popularity and ability to deliver products. This feature is built to enhance seller management efficiency.
§32 [Product Analytics](https://bytedance.feishu.cn/docx/JpKndokROoqcR0xVbJwcWwH3nVe)
Product Analytics
New Updates:
- NOTE: Newly added the "Export" function right after the button "Metrics".
- Delete the "All Creators" filter in [Video Analytics] and [Product Analytics].
- Remove the function "filter by" and support "search" by video/product name in [Video Analytics] and [Product Analytics].
- Exclude the metric "Shops" in core data and update the metric "Products" to "the number of products with sales during the selected period" in [Video Analytics] and [Product Analytics].
- User profile: Provide age, gender and country/regions distribution in [Video Details] and [Product Details].
§33 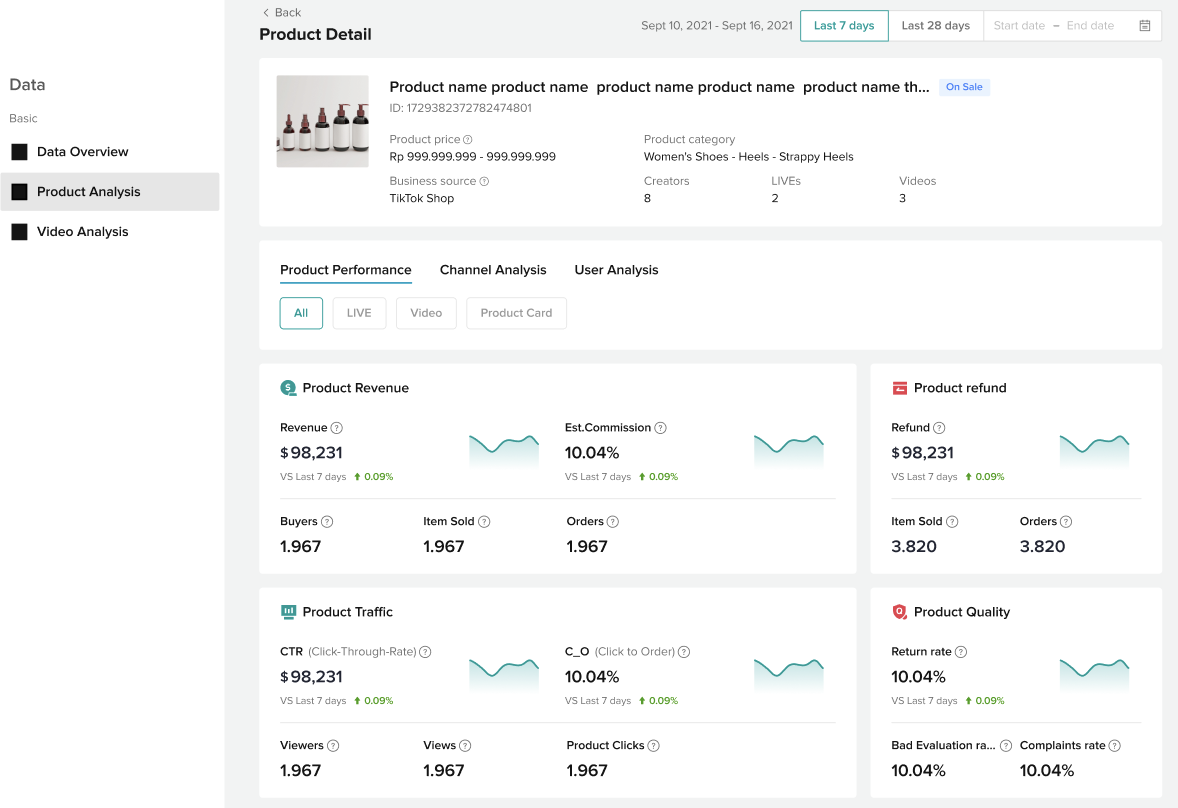
Image
How to use Product Analytics? 🔥Scenario 1: Monitor every creator's product sales performance Partners can view the overall sales, commission income, and sales trends of specific accounts for the selected time period by selecting different accounts. By viewing the sales trends of products, you can understand the changes in a specific account's output and ability to sell goods. You can also spot accounts which are displaying a significant decrease in their ability to sell goods. Image Scenario 2: Find the best selling product of a specific account Agencies can view the performance of all the products sold by each account in terms of transactions, impressions, clicks, conversions, negative reviews, complaints, refunds, and so on, to find the most suitable types of product sold by that account and help them to optimize their product selection strategies. Image Image 🔥Scenario 3: View the performance of transaction, refund, conversion, and service indicators of a single product by different channels The organization can view the transaction, refund, exposure, conversion, and product quality performance of this product by [All], [Live], [Video], and [Product Card] different channels. The core indicators are:
- Transaction performance:Revenue, Orders, Item sold, Buyers
- Refund performance:Refund revenue, Refund orders, Refund item sold
- Traffic performance:Views, Viewers, Product Clicks, CTR, C_O
- Product quality:Return rate, Negative review rate, complaint rate
Image 🔥Scenario 4: View the percentage of deals brought by different creators to the item and the high revenue excellent content Agencies can see the amount and percentage of sales for each creator and the number of live streams/videos that sold the product. Agencies can also see the percentage of sales from different channels of live/video/merchandise cards. Image It helps agencies find the videos and livestreams that bring the highest sales to the product. Agencies can learn from the best content and imitate the content production methods to create more explosive content. 🔥Scenario 5: Understand the conversion efficiency and user profile of products It helps organizations understand the conversion efficiency of the exposure-click-order traffic funnel of products and the user profile of each layer of the funnel. Agencies can view phone price range distribution and video preference of users for exposure, click, and transaction users. And according to the differences in the portraits of different categories of people, they can find the types of people with higher conversion efficiency and locate the target groups of products. Image
§34 Details of Product Analytics
Details of Product Analytics
- Select time period
You can choose to view data from the previous 6 months, the last 28 days, the last 7 days, specific days, weeks or months, and custom time periods. Notes:
- When a custom time period is selected, UV indicators (Buyers and Viewers) are not displayed.
- If the account has not been authorized to view the data for the selected time period, the data cannot be viewed when the time period is selected.
Image
- Select account
Agencies can select different accounts to view their performance over a set period of time and compare the previous cycle's indicator fluctuations, with the following core indicators.
- Revenue
- Products:the number of products with sales during the selected period
- Items sold
- Orders
- Select up to 2 indicators at a time to view the trends.
<div style="text-align: center"><img src="https://p16-arcosite-sg.ibyteimg.com/tos-alisg-i-k9wyc2ijk0-sg/2cdda6f490c24e7897ae2e03d6ae50f1~tplv-k9wyc2ijk0-image.image" width="1096px" /></div>
- Product sales performance
Partners can view the transaction performance of different products across different channels, the overall conversion performance, the negative review rate, number of refunds and complaint rate.
- Transaction performance: Revenue, Refund, Commission, Buyers, Orders, Items Sold, Refund unit sales for all channels
- LIVE: Revenue, Buyers, Items Sold
- Video: Revenue, Buyers, Items Sold
- Showcase: Revenue, Buyers, Items Sold
- Traffic and conversion performance: Views, Viewers, Product clicks, CTR, C_O
- Product quality performance: Return rate, negative review rate, complaint rate NOTE: Newly added the "Export" function right after the button "Metrics". Image Image
- View product transaction, channel and user analysis
Organizations can click on the product's [Details] to enter the details page to view the performance of individual products.
- Transaction Analysis
- Support agencies to view the effect data of commodities:
- Transaction performance:Revenue, Orders, Item sold, Buyers
- Refund performance:Refund revenue, Refund orders, Refund item sold
- Traffic performance:Views, Viewers, Product Clicks, CTR, C_O
- Product quality:Return rate, Negative review rate, complaint rate
<div style="text-align: center"><img src="https://p16-arcosite-sg.ibyteimg.com/tos-alisg-i-k9wyc2ijk0-sg/b5cd5864d44d4c0eabbe9f0b717d961b~tplv-k9wyc2ijk0-image.image" width="1178px" /></div>
- Channel Analysis
- By splitting the merchandise transactions according to the Creator dimension, you can view the individual Creator's:
- revenue, Percentage of transactions(The proportion of the transaction amount of the goods delivered by the person in the selected time period to the total transaction amount of the goods), Orders, Item Sold, Buyers
- Split the product transaction by transaction channel, you can view the product in different channels:
- revenue, Percentage of transactions, Orders, Item Sold, Buyers,CTR,C_O
- Support to view the video with the most transactions for the product, click on the video details to jump to the video analysis page
- revenue, orders, item sold, buyers
- Support viewing the livestream with the most transactions for the product.:
- live-stream room name, start time, creator name&picture of this livestream, revenue, orders, item sold, buyers
<div style="text-align: center"><img src="https://p16-arcosite-sg.ibyteimg.com/tos-alisg-i-k9wyc2ijk0-sg/a2c1e61f523043db843068b1be6e3428~tplv-k9wyc2ijk0-image.image" width="874px" /></div>
- User Profile
- Show the conversion rate between Product viewers-Product click user \ Product click user-Buyers \ Product viewers-Buyers respectively, and show the trend of this User by day in the selected time period on the right
- Support viewing user portraits by product impression, product click, and product buyers:
- Age: 18-24, 25-34, 35+, Unknown
- Gender: Male, Female, Others ONLY show profile when the total group users are over 1000
<div style="text-align: center"><img src="https://p16-arcosite-sg.ibyteimg.com/tos-alisg-i-k9wyc2ijk0-sg/a94997261c9244d9811cb3f06afefecb~tplv-k9wyc2ijk0-image.image" width="1026px" /></div>
§35 Video inspirations
#§36 High level overview
High level overview
Ready to be inspired? Video Inspiration for TTSPC brings agency partners relevant data and tons of ideas for creating highly engaging content and optimizing their video creation strategy. 📈 Visibility on critical metrics and data from top ranked videos, music and hashtags to help you understand successful content trends. 💬 Identifying drivers for fostering engagement and transaction and recommendations on how to make your videos more engaging. 🔬 Drilldown on interaction patterns for top ranking videos to understand detailed trends in user engagement.
§37 Feature value proposition
Feature value proposition
Video inspirations within TTSPC are intended to provide users with the insights and recommendations required to produce highly engaging and shoppable content. Users can benefit from:
- Insights and metrics from high-performing videos across categories and date ranges that allows TTSPC users to benchmark their own content against performant and successful shoppable videos.
- Recommendations and inspiration for scripting and conversation points that can unlock higher engagement and ultimately boost conversion.
- Visibility on other aspects of high-performance content (e.g. music, hashtags) that will increase are likely to increase impressions and conversion for published shoppable videos.
Ultimately, Video Inspiration for TTSPC aims to empower TTS partners with deriving insights and understanding the drivers behind creating content that will foster engagement and conversion for their managed creators and sellers.
<div style="text-align: center"><img src="https://p16-arcosite-sg.ibyteimg.com/tos-alisg-i-k9wyc2ijk0-sg/0044150356464b6ead60e1dc210920eb~tplv-k9wyc2ijk0-image.image" width="1820px" /></div>
§38 Feature component Details of Product Analytics walkthrough
Feature component Details of Product Analytics walkthrough
The following section elaborates the different components of the Video Inspiration functionality for Agencies within TTSPC ++Entrance++ Navigate to partner center and click into Video Inspiration section of the portal within Analytics tab. You can also use the link here.
| Platform | Navigation path | UI interface demo |
|---|---|---|
| TikTok Shop Partner Center | Partner Center > Analytics > Video Inspiration | Image Image |
++Applicable filters++ Authorized users will be able to filter data based on available parameters (described below). Filters are applied to all available content types, i.e Video, Music and Hashtags.
| Filter parameter | Filter description **** | UI interface demo |
|---|---|---|
| Product category | Drop-down list of available product categories. "All" categories selected by default | Image |
| Date range | Calendar element to select date range to filter results "Last 7 days" are selected by default. User can also select "Last 28 days" as preset date range Users can select custom date range but can only select one week of date range when selecting a custom range | Image |
++Script skills++ Script skills outline a set of best practices and helpful insights that make videos and content engaging. These content suggestions are based on trends observed in successful videos. Users can explore best practices and techniques and incorporate the same within published content to increase content engagement, impressions and conversion. Users can click on "Learn More" to view insights and best practices from the Script Skills Hub that are grouped into themes, allowing users to browse, explore and incorporate these elements into content.
| UI interface demo |
|---|
| Image Image |
++Inspiration content++ Inspiration content within the Video Inspiration section is grouped into top ranking videos, music and hashtags. 🎦 Top ranking videos
| Content | Elements and interactions | UI interface demo |
|---|---|---|
| Top videos list view | Within the "Video" tab, users can view a list of top shoppable videos, with applied filters and sorting parameters. Sorting of available results are supported for top videos. Sorting is available based on 1. Video views 2. Interactions 3. Finish rate Top 50 videos within selected filter range are displayed and users can navigate with pagination | Image |
| Top video preview card | For each video within Top videos list, the video card displays metrics related to video engagement, utilized script skills and information related to hashtags used in the video. Hovering over the video triggers autoplay preview. This information enables users to understand engagement metrics and utilize the rights hastags and incorporate skills to boost conversion | Image |
| Top video card details | Users can click on the "Details" button to perform a deep-dive on any video card. The detailed description contains the following information * Overview - Provides details of the video including used hashtags and music coupled with product information and link * Performance - Key performance metrics related to video engagement * Script skills - Description of script skills used in the video * Time series plot - Interactive trend plot that outlines video engagement metrics (views, likes) at a second level granularity Users can leverage this critical information to customize content with the aim of boosting engagement and conversion | Image |
🎵 Top ranking music
| Content | Elements and interactions | UI interface demo |
|---|---|---|
| Top music list view | Within the "Music" tab, users can view a list of top music being used in shoppable videos, with applied filters Top 50 songs within selected filter range are displayed and users can navigate with pagination. | Image |
| Top music preview card | For each song within Top music list, the music card displays videos that have utilized the song. Users can click on the "Detail" CTA, to navigate to the song's detailed description. | Image Image Image |
#️⃣ Top ranking hashtags
| Content | Elements and interactions | UI interface demo |
|---|---|---|
| Top hashtags list view | Within the "Hashtags" tab, users can view a list of top hashtags used in shoppable videos, with applied filters Top 50 hashtags within selected filter range are displayed and users can navigate with pagination. | Image |
| Top hashtags preview card | For each hashtag within Top hashtags list, the hashtags card displays videos that have utilized it. Users can look at the number of views of videos with the hashtag within the selected filter range as well as total number of views. Finally, users can click on the "Detail" CTA, to navigate to the hashtag's detailed description. | Image Image Image |
§39 Q&A
Q&A
- Why are the common data indicators in the live room floating?
- Each data indicator will be compared with the last five minutes and updated every minute
- how many sellers can get into the live screen at the same time?
- Max 5
- What is the query range of the historical live room data?
- The live room which is after signing the contract can be found, and the live room data during the contract time will be provided.
- Example: If A signs a contract with the partner on May 1, 2020, A terminates the contract on October 1, and re-signs on July 1, 2021. Then the partner can apply for 2020.5.1-2020.7.1&2021.7.1-current data permissions.
- Why is it impossible to see video details for some video?
- Videos, whose status are set to private or deleted, do not support playback and cannot display video pictures;
- Videos, whose status are set to private and have never been made public, have no transaction or content data;
- Why are the recommended videos with high revenue not shown in the transaction analysis in the video detail page?
- For videos with multiple product links, you need to select one product in the video detail page-transaction analysis, and the video of the TOP3 revenue amount in all videos (including the Creator/Merchants' own short video and other Creator/Merchants' short videos) with the same product will be displayed below the transaction analysis.